Python is powerful. But utilising that power requires access to good data. And financial data can be expensive to get. Here are some free alternatives.
Extracting financial data via API calls
Application Programming Interfaces (APIs) allow programs to talk to one another, thus allowing for much stronger efficiency compared to life without APIs.
One of the most useful API providers for financial data is Quandl. They’re in the business of data, so naturally, not all their data is free.
But you can get access to stock price data from Quandl, for free.
Installing Quandl
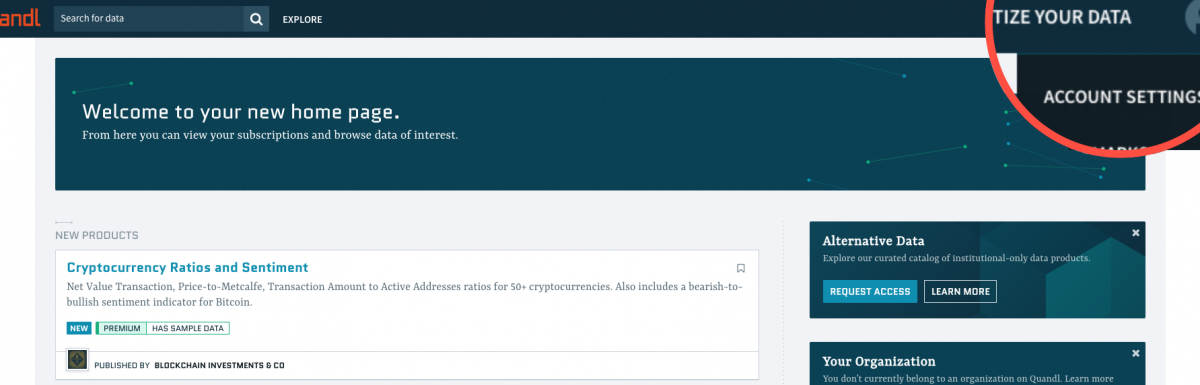
First, you’ll need to signup on their website. Once you’ve signed up, head over to your Account settings on the top right:

Once you’re in, you’ll see your API key. I’ve blurred mine out for obvious reasons, of course. By the way, never share your API keys – any API key – with anyone.

Next, install Quandal via pip, by opening up your terminal / command prompt and typing:
pip install quandl
If that doesn’t work, try:
pip3 install quandl
Lastly, import Quandl in your development environment by calling:
import quandl
Extracting data from Quandl
Extracting data for a single stock
Say for instance you want to get Apple’s (AAPL) price data. You can get this by using Quandl’s .get() method.
Most of the time, when we’re working with price data, we tend to work with the Adjusted Close. That’s mainly because the Adjusted Close incorporates effects like stock splits, bonuses, dividend payments, etc.
In this particular dataset, we have 12 columns. Now of course, we could just delete all the other columns and just keep the Adj. Close column by…
price_aapl = price_aapl[['Adj. Close']]
Alternatively, if we know we only need the Adj. Close column, then we can just get that particular data by specifying the column number.
We can see the Adj. Close is the 11th column (note that Quandl doesn’t start its column indexes as 0). All we need to do is specify .11 after the ticker.
Now, this dataset starts from 1980 (when Apple was listed), and goes all the way through to the end of March 2018. Note that Quandl won’t give you the most recent price data for free.
If we only wanted say, the last 10 years of data, then we can specify this when we make the call via `.get`:
Extracting data for multiple stocks
Of course, we mainly tend to work with several stocks instead of just the one when doing any sort of meaningful data analysis.
I just chose 10 stocks at random, including:
- Facebook (FB)
- Apple (AAPL)
- Google (GOOGL)
- Amazon (AMZN)
- Netflix (NFLX)
- Visa (V)
- General Electric (GE)
- Tesla (TSLA)
- Berkshire Hathaway (BRK_B), and
- Coca Cola (KO)
We’d need each ticker to be named in a way Quandl understands, namely with the prefix “WIKI/” and the suffix “.11” (if we only want the Adj. Close data).
If you’re like me, you’re probably too lazy to sit and type that out for each stock.
Thankfully, we can automate this with Python.
I start by just typing out the list of tickers rather haphazardly.
# Specify tickers we want
tickers = ["fb aapl googl amzn nflx v ge tsla brk_b ko"]
Next, I make all tickers upper case, and separate them so they’re individual items in a list.
# Make them all upper case, and individual items in a list
tickers = [tic.upper().split() for tic in tickers]
This code also meant that we now have a list within a list, so the output actually looks like this:
But we can ‘flatten’ this nested list by going….
# Flatten the nested list
tickers = [tic for sublist in tickers for tic in sublist]
And lastly, we can just add the prefixes and suffixes for each stock by calling…
# Add "WIKI/" as a prefix and ".11" as a suffix to each ticker
tickers_quandl = ["WIKI/" + tic + '.11' for tic in tickers]
Here’s the full code so far…
With the tickers formatted in a way Quandl likes, we’re now ready to get our data! To do that, we’ll use the same .get() method we used earlier, only this time we’ll specify a list of tickers (tickers_quandl) instead of just a single stock.
# Extract Adj. Close data for all stocks
prices_df = quandl.get(tickers_quandl, start_date="2009-01-01")
Now naturally, our column names still have the “WIKI/” prefixes and “.11” suffixes, which aren’t informative as far as data analysis goes.
So we can get rid of them and leave the tickers as the column names by…
# Remove "WIKI/" and "Adj. Close" from each column
prices_df.rename(columns={col : col.split('/')[1].split()[0] for col in prices_df.columns},
                inplace=True)
And that’s it!
We have all the data we need, in a format that works well for data analysis.
Note that TSLA and FB weren’t listed in 2009 so we have NaN observations for the dates which these two stocks weren’t listed.
Here’s the full code for our multiple stocks data extraction activity…
So there you have it! That’s how you can extract financial data on Python using Quandl’s API.
Leave a Reply